Performance Details
This section contains more detail about the predicted performance of the link. The data can either be displayed in chart or tabular form.
Charts
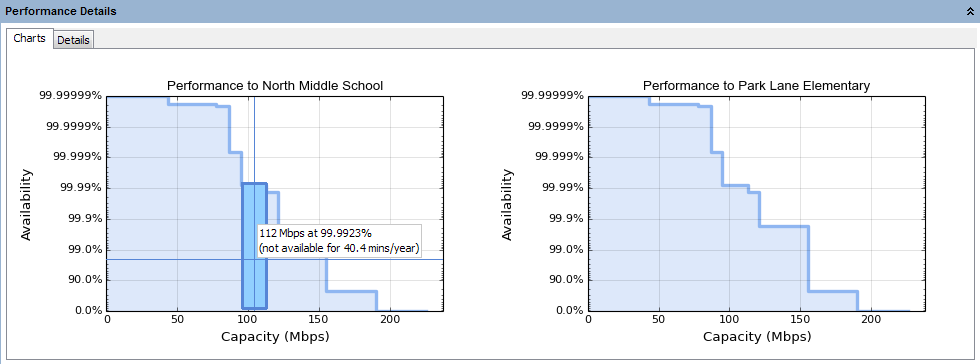
The following charts show the variability in percentage of time availability with capacity, for each direction in the link. When the cursor is moved over the chart the area is highlighted in blue and the chart is annotated with throughput, availability (given as a percentage) and unavailability (given as a unit of time). The throughput given is the maximum throughput at that availability.
Performance Charts
When Dual Payload is enabled the availability shown is the sum of Receive time in Mode for all single and dual payloads with a Max IP Throughput greater than or equal to the given capacity level.
If ePMP, PTP 250, PTP 550, PTP 820 or PTP 850 are selected the capacity shown in both the charts and the table is for the given frame size selected.
If ePMP Enhanced PTP Mode, PTP 250 or Adaptive Symmetry is selected the capacity achieved in each direction of the link is variable, depending on the load presented. The charts cannot predict the load for each direction of the link and therefore present data for two conditions, see Performance Charts for Adaptive Symmetry.
- When traffic is only being sent in one direction the other direction has no load on it and a peak throughput can be achieved in a single direction at a given time.
- When one direction of the link is saturated the maximum throughput in the other direction balances that load and provides a symmetrical throughput in each direction, for identical link conditions. In this case the values shown in the chart correlate with the values shown in the Performance Summary section.
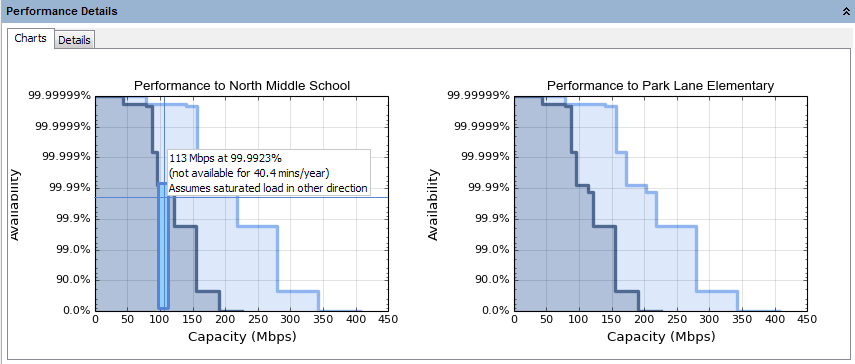
Performance Charts for Adaptive Symmetry
 - high capacity, which can only be achieved in this direction assuming there is no load in the other direction.
 - symmetrical capacity, which can be achieved assuming a saturated load in the other direction. This capacity can be achieved simultaneously with the equivalent load shown on the opposite direction of the link.
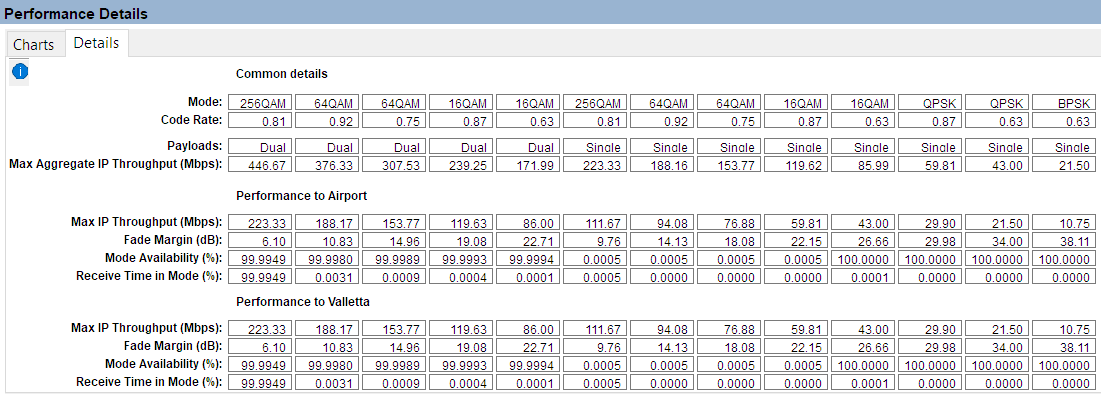
Common Details
MCS: (ePMP and cnWave Only) The Modulation Coding Scheme Number
Mode: The modulation technique used.
Code Rate: The code rate for the specified Mode (not available for PTP 820, PTP 850, PTP 450 or PTP 450i).
Profile: (PTP 820 and PTP 850 Only) The profile number of the modulation mode.
MIMO Type: (PTP 450 and 450i Only) The MIMO method used.
Payloads: (ePMP, PTP 550, 650, 670 or 700) Indicates whether the payload mode is Single or Dual.
Multiplier: (PTP 450 and 450i Only) Indicates the relative capacity capability of the different modes.
Max. Aggregate IP Throughput (Mbps): The maximum aggregate throughput achievable (sum of both directions). This field is automatically adjusted for the range of the link being studied.
STM-1 Carried: This row is only displayed if the equipment is PTP 810.
E1/T1 Carried: This row is only displayed if the equipment is PTP 650, PTP 670, PTP 700, PTP 810, PTP 820G or PTP 820F and one or more E1 or T1 channels have been selected. It indicates the number of E1 or T1 channels supported in each modulation mode. For PTP 650, PTP 670 or PTP 700 it is set to “Timing” for those modulation modes that are below the Lowest Telecom Mode selected in the Equipment section, for more information, see Optimizing E1 or T1 Latency.
Performance to each end
Max. IP Throughput (Mbps): The maximum user throughput achievable. For modulation modes below Lowest Ethernet Mode this value will be set to zero and no contribution from these modulation modes will be included in the Mean IP Predicted.
Fade Margin (dB): The margin available to each end in the specified Mode.
Mode Availability (%): The percentage of time that the data throughput rate shown for each end will be available.
Receive Time in Mode (%):The percentage of time used to receive data in the specified Mode.
When ePMP Enhanced PTP Mode, PTP 250 or Adaptive Symmetry is selected the values shown in the Performance to each end section of the table assume that there is no load in the opposite direction of the link.
Select the ![]() icon in the top left of the Performance Details Table to get a Pop-up table of the Performance details.
icon in the top left of the Performance Details Table to get a Pop-up table of the Performance details.
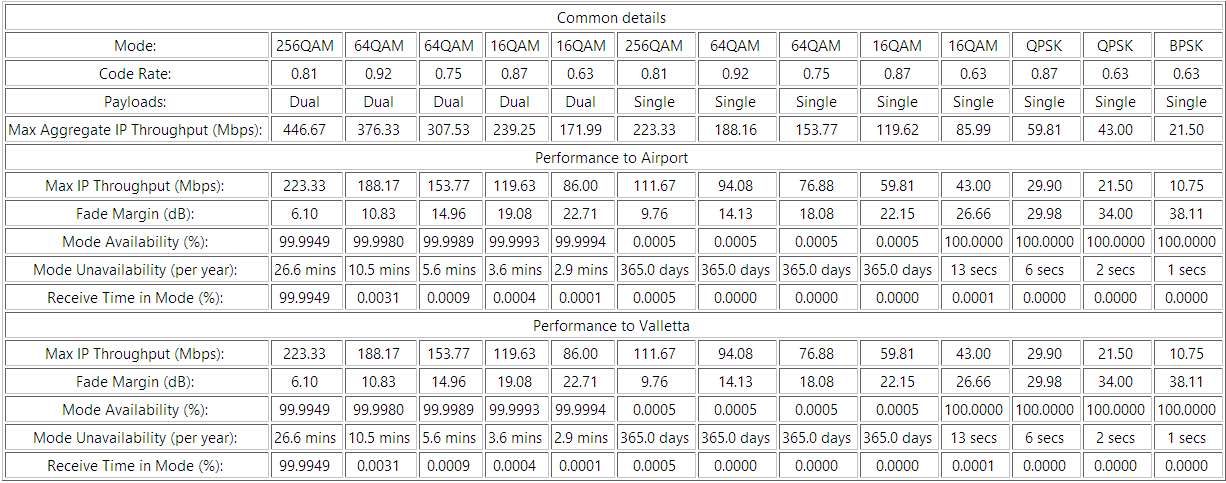
Performance Details Pop-up
In addition to the rows shown in the Performance Details table this also includes extra rows to show:
Mode Unavailabillity (per year):The amount of time measured in seconds, minutes, hours or days that the link is predicted to be unavailable.
To copy the data from the table, right click in the table and paste into a spreadsheet.

This data does not keep the formatting when pasted into text based programs.