Using Google Earth(TM)
The link profile can be viewed as a Google Earth(TM) aerial photograph (if it is available). Air photographs help the planner to identify potential obstructions and estimate their heights and positions.
Viewing Links and Sites in Google Earth(TM)
To view a link, select the link in the LINKPlanner navigation tree, then click Google Earth ![]() .
.
The aerial photograph is displayed, zoomed into and centered on that link, as shown in the following example (Google Earth(TM) Aerial Photograph with Distances Shown):
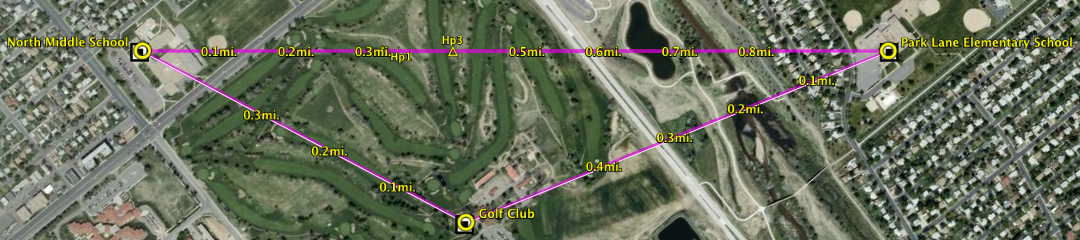
Google Earth(TM) Aerial Photograph with Distances Shown
To view a site, select the site in the LINKPlanner navigation tree, then click Google Earth ![]() .
.
The aerial photograph is displayed, zoomed into and centered on that site, with links displayed.
Previewing Link Profiles
To preview link profiles in Google Earth(TM), click on a Site (as represented by a yellow circle). A ‘bubble’ opens up which contains the link profiles to up to 10 adjacent sites. This feature is useful when potential Sites have been identified and entered in LINKPlanner. The link profiles between those potential sites can be previewed in Google Earth(TM) to see which links are definitely line of sight (and therefore worth pursuing), or VERY non-line of sight (in which case they may not be worth pursuing).
Distance and Zoom in Aerial Photographs
Zoom into areas of the photograph where obstructions may be present, as shown here (Google Earth(TM) Aerial Photograph (Zoomed)):
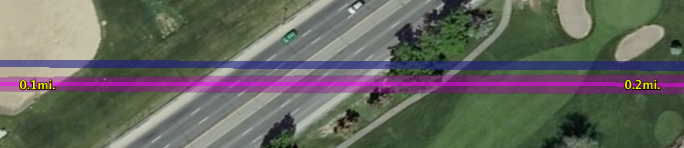
Google Earth(TM) Aerial Photograph (Zoomed)
The distance along the line is displayed, negating the need for the ruler to be used. On long links the distance resolution increases or decreases with the zoom. The maximum resolution presented is 0.1 km or 0.1 miles depending upon the LINKPlanner Length preference/options set.
Color Code in Aerial Photographs
Magenta lines - LoS links: The magenta lines represent LoS links between sites.
White lines - links with no profiles: The white lines represent LoS links for which LINKPlanner has no profiles.
Magenta transparent area - ground Fresnel zone: The magenta transparent area represents the projection of the Fresnel cigar shaped tube on the ground. Obstructions can be easily compared with this Ground Fresnel zone to establish their significance. The zoomed example photograph shows a tree at 0.26 miles (0.42 km) that is wider than the Fresnel zone and thus, if it is high enough, is of significance. The shadows and general size suggest that it may be 30 ft (9.2 m) high.
Blue translucent area - vertical Fresnel zone: The blue translucent shaded area represents the Vertical Fresnel zone as seen from the air (Fresnel zone representation in Google Earth). It has no thickness and so may not be seen when the observer is immediately above the link.
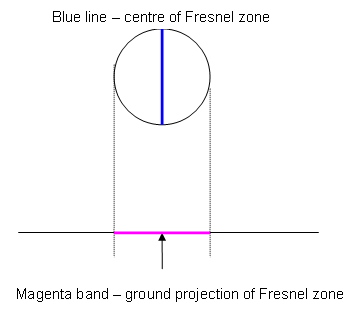
Fresnel zone representation in Google Earth
High Points in Aerial Photographs
Hp1-3 identify points which have the greatest significance to the excess path loss of the link. Hp1 has the greatest significance while Hp2 is the largest effect on the left hand side of the link and Hp3 is the largest effect on the right hand side of the link.
When an obstruction is identified, with practice, the height of the obstruction can be estimated and quickly added to the profile using the range markers and the profile editor.